This post was translated from the original with AI assistance. Read the original
Reposted from my notes on FlowUs (written 2023-03-10); formatting tidied during migration.
We are now in the era of game industrialization: the whole game development process is a pipeline governed by strict standards. From incubation through development, launch and live operations, a variety of tools and conventions safeguard our workflow. They keep the process standardized and consistent and ensure the quality of what we deliver. In the end, this pipeline has to deliver high-quality games.
Introduction#
Every company has its own internal coding standards, covering naming, formatting, syntax and so on. In most cases, though, we don’t actually run a full code analysis and fix pass. Before making good use of professional tools, we mostly relied on leads doing code reviews. That keeps code quality and consistency acceptable most of the time, but things inevitably slip through, and it is not very efficient. We want strict rules to be enforced right at the editing stage, and that is entirely feasible today.
Our company uses Unity as its core game engine, and our newest server framework is built on .NET 6.0. This means both client and server programmers use C# as their main language.
.NET has evolved rapidly in recent years and new C# language features keep coming. Some of them fit our needs; others are frankly baffling. We need to decide which features are allowed and which are forbidden.
Our CI runs on Jenkins. We can write Groovy scripts and other platform-specific scripts (bat/PowerShell or sh/bash) to heavily customize the CI pipeline, and our goal is to add a code analysis step to the Build pipeline.
We need to unify our coding standards. Code that violates them should first produce warnings and errors in the IDE, and second, should break the Build step of the CI process, with the offending code locations collected, reported and fed back to the responsible programmers. That way we can guarantee code quality and consistency as far as possible.
Recently, a senior colleague and I did some technical research on “ensuring C# code quality and style consistency”. The goal was to figure out, in the era of game industrialization, how to strictly enforce unified coding standards, how to make sure C# code meets the expected quality, and how to integrate code analysis into the CI process.
Our final conclusions:
- Use Roslyn
- Use ReSharper’s command-line tools InspectCode (decided) and CleanupCode (under discussion)
- Write a command-line tool and add a code analysis step to the Jenkins Build Pipeline
About Roslyn#
Roslyn is Microsoft’s open-source implementation of the C#, VB and F# compilers; it is a compiler platform. It provides APIs and an SDK that let us build our own code analyzers (Code Analyzer) on top of the Roslyn SDK. With the code analysis and code fix capabilities the Roslyn SDK provides, we can ensure code quality and style consistency.
Building a code analyzer gives us a NuGet package. Once a project installs that package, Visual Studio provides analysis both while editing and at compile time. Besides the NuGet package, we also get a VSIX file (a Visual Studio extension installer). With that extension installed, Visual Studio provides analysis while editing, but not at compile time. An analyzer obtains the code’s syntax tree (Syntax Tree), performs syntactic and semantic analysis, and checks whether the code violates the set of rules we defined. If it does, the analyzer reports a diagnostic. When VS receives a diagnostic from Roslyn, it looks up one or more code fix providers (CodeFixProvider) matching the diagnostic ID. The user can pick one to run the corresponding code fix (Code Fix) logic, which performs a syntax transformation. Put simply: a warning or error appears in Visual Studio (usually a blue or red squiggle, with a light bulb nearby) prompting the user to apply a code fix, and when the user clicks a fix option, the fix logic is applied.
This scenario is surely familiar to everyone, because Microsoft has already written the basic C# analyzers on top of Roslyn, and the projects we create reference and load them by default. That’s why we often see little light bulbs during development, consider whether to follow their suggestions, and after choosing one of the fix options, our code gets improved or corrected accordingly.
For a more concrete example, Unity actually implements its own code analyzers. When a Unity developer writes code in Visual Studio that violates Unity’s development guidelines or is not recommended (for example var component = new MonoBehaviour();, or an empty Update method), VS prompts the developer to apply a code fix. A warning or error appears in the developer’s IDE; hovering over it shows the diagnostic message along with the available code fixes, and choosing one fixes the code.
Unity’s code analyzer repository is here:
GitHub - microsoft/Microsoft.Unity.Analyzers: Roslyn analyzers for Unity game developersRoslyn analyzers for Unity game developers. Contribute to microsoft/Microsoft.Unity.Analyzers development by creating an account on GitHub. GitHub
In addition, ReSharper’s command-line tools InspectCode and CleanupCode do similar work, namely analyzing and cleaning up code. Why use ReSharper when Roslyn already exists? I’ll explain the reasons later.
Analyzing and Fixing Code with Roslyn#
Prerequisites:
- Visual Studio 2022 (recommended) or Visual Studio 2019 (16.8 or later; not recommended, outdated)
- .NET Framework 4.6 or later; .NET Framework 4.8 recommended
- .NET SDK 6.0 or later; installing both 6.0 and 7.0 is recommended
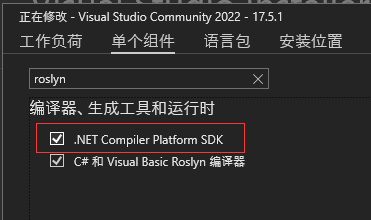
- Roslyn SDK
To install the Roslyn SDK, just download the individual component in the Visual Studio Installer:
Creating an Analyzer with Code Fix Project#
First, create an Analyzer with Code Fix project from the template. It will produce the code analyzer (a NuGet package or a VSIX extension).
Of course, the Roslyn SDK also supports creating standalone code analysis command-line tools and code refactoring extensions. I won’t go into those here; I may write about them in a future post.
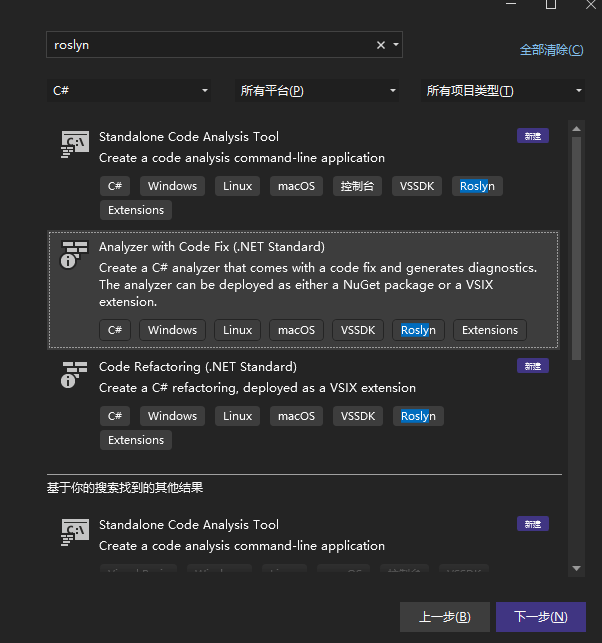
Here I named the solution HelloRoslyn:
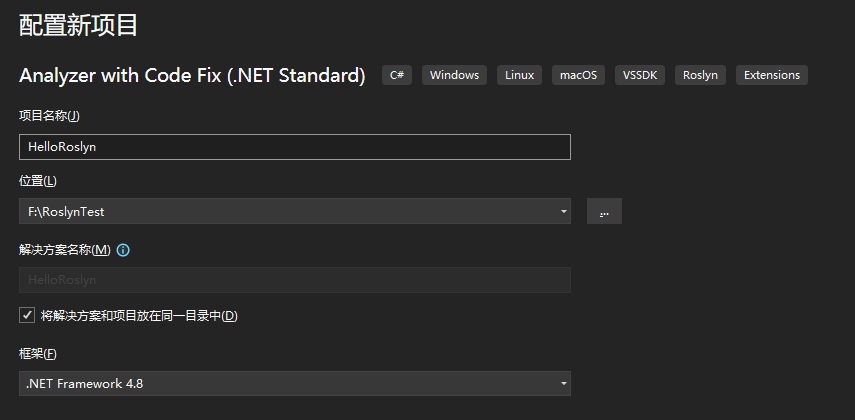
Once created, the solution consists of the following projects:
- HelloRoslyn
- HelloRoslyn.CodeFixes
- HelloRoslyn.Package
- HelloRoslyn.Test
- HelloRoslyn.Vsix
The HelloRoslyn Project#
This project contains the code analyzer.
In Roslyn, analyzers are collected via reflection. Roslyn collects every type that meets both of the following conditions:
- Derives from the
DiagnosticAnalyzertype - Is marked with the
DiagnosticAnalyzerattribute
Note that if a type doesn’t meet both conditions, it won’t be collected, i.e. it won’t take effect.
In this template project’s HelloRoslynAnalyzer.cs, our HelloRoslynAnalyzer derives from DiagnosticAnalyzer and is marked with the DiagnosticAnalyzer attribute. It is collected via reflection into a set of analyzers, and Roslyn ultimately runs every analyzer in that set.
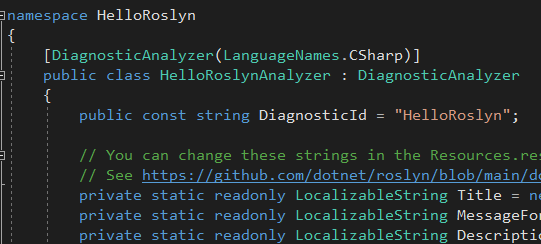
The DiagnosticAnalyzer attribute specifies the language being analyzed. The options are CSharp (C#), VisualBasic (VB) and FSharp (F#), all Microsoft’s own languages. We are analyzing C#, so we just pass LanguageNames.CSharp.
DiagnosticAnalyzer provides the basic functionality for code analysis, along with some virtual methods for us to override, such as DiagnosticAnalyzer.Initialize(AnalysisContext). In this method we can register analyzer callbacks: when Visual Studio detects a code edit matching a registered action, the callback we registered is invoked. In the callback, when the conditions for raising a diagnostic are met, we create a diagnostic object, which Visual Studio uses to show the user a warning or error description.
In this example, a symbol action (Symbol Action) callback AnalyzeSymbol is registered, and the symbols to analyze are named types (SymbolKind.NamedType).
HelloRoslynAnalyzer: registration
        public override void Initialize(AnalysisContext context)
        {
            context.ConfigureGeneratedCodeAnalysis(GeneratedCodeAnalysisFlags.None);
            context.EnableConcurrentExecution();

            // TODO: Consider registering other actions that act on syntax instead of or in addition to symbols
            // See https://github.com/dotnet/roslyn/blob/main/docs/analyzers/Analyzer%20Actions%20Semantics.md for more information
            context.RegisterSymbolAction(AnalyzeSymbol, SymbolKind.NamedType);
        }

        private static void AnalyzeSymbol(SymbolAnalysisContext context)
        {
            // TODO: Replace the following code with your own analysis, generating Diagnostic objects for any issues you find
            var namedTypeSymbol = (INamedTypeSymbol)context.Symbol;

            // Find just those named type symbols with names containing lowercase letters.
            if (namedTypeSymbol.Name.ToCharArray().Any(char.IsLower))
            {
                // For all such symbols, produce a diagnostic.
                var diagnostic = Diagnostic.Create(Rule, namedTypeSymbol.Locations[0], namedTypeSymbol.Name);

                context.ReportDiagnostic(diagnostic);
            }
        }
In the AnalyzeSymbol method, the parameter gives us the current symbol analysis context (SymbolAnalysisContext). This is the context for a single matching symbol that Roslyn picked out after analyzing the code’s syntax tree; in fact, the callback runs once for every matching symbol. Through this context we can get the symbol’s name. In this example, we check whether the symbol name contains any lowercase characters; if it does, we create a diagnostic object and report it through the context. Visual Studio collects this diagnostic and eventually shows a squiggle in the IDE with the relevant diagnostic information.
The rule behind the “create a diagnostic” behavior is one we define ourselves; it is an object of type DiagnosticDescriptor.
We usually create static readonly fields of type DiagnosticDescriptor inside a concrete Analyzer type.
Constructing a DiagnosticDescriptor typically requires the following key pieces:
- Diagnostic ID (uniquely identifies the diagnostic; a globally unique string such as
"HELLO_ROSLYN_0001") - Diagnostic title (the title describing the diagnostic; supports localized strings configured in
Resources.resx) - Diagnostic message format (a format string describing the specifics of the diagnostic, such as
"Type name '{0}' contains lowercase letters", i.e. a format string with placeholder substitution; supports localized strings configured inResources.resx) - Diagnostic category (describes the category of the diagnostic, such as
"Design"or"Naming"; used for grouping, with no strict naming requirements) - Diagnostic severity (the level of the diagnostic:
Hidden,Info,WarningorError, which map to hidden, info, warning and error in the IDE; we generally chooseWarningorError.) - Diagnostic description (detailed information about the diagnostic, telling the user why it was raised, such as
"Type names should be all uppercase."; supports localized strings configured inResources.resx)
Besides symbol actions, many other kinds of actions can be registered, such as code block actions, compilation actions, operation actions, syntax node actions and more:
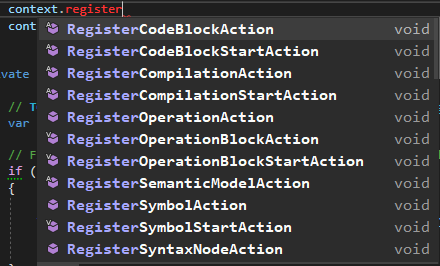
API documentation:
AnalysisContext Class (Microsoft.CodeAnalysis.Diagnostics)Context for initializing an analyzer. Analyzer initialization can use an AnalysisContext to register actions to be executed at any of: compilation start,compilation end,completion of parsing a code d… learn.microsoft.com
We can register whichever action callbacks we need, create the diagnostic objects, and report diagnostics when the conditions are met. VS can then display the corresponding warnings or errors.
The HelloRoslyn.CodeFixes Project#
This project contains the code fix providers. It only provides one, but in practice we can provide one or more code fix providers for a single analyzer.
Once Roslyn collects a diagnostic and hands it to VS, VS tries to find code fix providers matching the diagnostic’s ID, and the user can then choose one of the fix options offered by those providers to fix the code. If VS can’t find a matching code fix provider, it shows an error in the diagnostic tooltip.
In Roslyn, code fix providers are also collected via reflection. Roslyn collects every type that meets both of the following conditions:
- Derives from the
CodeFixProvidertype - Is marked with the
ExportCodeFixProviderattribute
Likewise, note that if a type doesn’t meet both conditions, it won’t be collected, i.e. it won’t take effect.
In this template project’s HelloRoslynCodeFixProvider.cs, our HelloRoslynCodeFixProvider derives from CodeFixProvider and is marked with the ExportCodeFixProvider attribute. It is collected via reflection into a set of code fix providers. For each diagnostic, VS finds all the matching code fix providers and offers them to the user, which shows up as one or more fix options after clicking the light bulb. When the user clicks a specific option, Roslyn runs the code fix callback of the corresponding provider.

The ExportCodeFixProvider attribute specifies the language being analyzed and the name of the code fix provider. Again, the language options are CSharp (C#), VisualBasic (VB) and FSharp (F#). We are analyzing C#, so we just pass LanguageNames.CSharp. In the example, we name the provider HelloRoslynCodeFixProvider.
CodeFixProvider provides the basic functionality for code fixes, along with some virtual methods for us to override, such as CodeFixProvider.RegisterCodeFixesAsync(CodeFixContext). In this method we can register fix callbacks: when the user clicks a fix option, the callback we registered is invoked. The callback is asynchronous. In it, we get the code’s document object and syntax structure. At this point we have several choices:
- We can create and return a new solution object (of type
Microsoft.CodeAnalysis.Solution). That is, after the user clicks the fix option, the relevant code across the whole solution is fixed (replaced). - We can create and return a new document object (of type
Microsoft.CodeAnalysis.Document). That is, after the user clicks the fix option, the code in the document currently being edited is fixed (replaced).
In this example, a solution-modifying callback MakeUppercaseAsync is registered. From its parameters it gets the code document, the type declaration syntax, and a CancellationToken for cancelling the asynchronous operation. The method takes the type with lowercase characters that the analyzer flagged earlier, converts the text (Text) of the type’s token to all uppercase, gets the document’s semantic model and from it the symbol for the type, then creates a new solution object with the symbol renamed (by calling Renamer.RenameSymbolAsync), and returns the new solution.
HelloRoslynCodeFixProvider: registration
        private async Task<Solution> MakeUppercaseAsync(Document document, TypeDeclarationSyntax typeDecl, CancellationToken cancellationToken)
        {
            // Compute new uppercase name.
            var identifierToken = typeDecl.Identifier;
            var newName = identifierToken.Text.ToUpperInvariant();

            // Get the symbol representing the type to be renamed.
            var semanticModel = await document.GetSemanticModelAsync(cancellationToken);
            var typeSymbol = semanticModel.GetDeclaredSymbol(typeDecl, cancellationToken);

            // Produce a new solution that has all references to that type renamed, including the declaration.
            var originalSolution = document.Project.Solution;
            var optionSet = originalSolution.Workspace.Options;
            var newSolution = await Renamer.RenameSymbolAsync(document.Project.Solution, typeSymbol, newName, optionSet, cancellationToken).ConfigureAwait(false);
            // Return the new solution with the now-uppercase type name.
            return newSolution;
        }
So when the user names a type with lowercase characters and the editor shows the warning, clicking the fix option renames every such type across the entire solution to all uppercase.
The HelloRoslyn.Package Project#
This project rarely needs changes. It already contains the NuGet package’s install and uninstall scripts, which are PowerShell scripts. You only need to modify them if you have specific requirements.
Building this project produces a NuGet package file, which can be added as an analyzer to any project that supports .NET Standard 2.0.
Recent versions of both .NET Framework and .NET Core implement .NET Standard 2.0, so this NuGet package works with modern versions of both .NET Framework and .NET.
The HelloRoslyn.Test Project#
This project is for writing test cases. We can hard-code some strings to simulate code documents and build the expected results, then test our analyzer and fix provider.
The verifiers in the Verifiers folder basically don’t need changing; they work out of the box. Of course, we can extend them too.
In the sample, our TestMethod1 demonstrates the test pattern that ensures the analyzer doesn’t report a diagnostic when it shouldn’t.
TestMethod2 tries a diagnostic via VerifyCS.Diagnostic with diagnostic ID "HelloRoslyn", inserting an argument at location 0; that argument fills location 0 in the test string, i.e. the class name TypeName. As we know, any lowercase character in a class name triggers the diagnostic, so it is triggered here. Then VerifyCS.VerifyCodeFixAsync compares and verifies the original document content, the expected fixed content, and the actual fixed content.
HelloRoslynUnitTests.cs
using Microsoft.VisualStudio.TestTools.UnitTesting;
using System.Threading.Tasks;
using VerifyCS = HelloRoslyn.Test.CSharpCodeFixVerifier<
    HelloRoslyn.HelloRoslynAnalyzer,
    HelloRoslyn.HelloRoslynCodeFixProvider>;

namespace HelloRoslyn.Test
{
    [TestClass]
    public class HelloRoslynUnitTest
    {
        //No diagnostics expected to show up
        [TestMethod]
        public async Task TestMethod1()
        {
            var test = @"";

            await VerifyCS.VerifyAnalyzerAsync(test);
        }

        //Diagnostic and CodeFix both triggered and checked for
        [TestMethod]
        public async Task TestMethod2()
        {
            var test = @"
    using System;
    using System.Collections.Generic;
    using System.Linq;
    using System.Text;
    using System.Threading.Tasks;
    using System.Diagnostics;

    namespace ConsoleApplication1
    {
        class {|#0:TypeName|}
        {
        }
    }";

            var fixtest = @"
    using System;
    using System.Collections.Generic;
    using System.Linq;
    using System.Text;
    using System.Threading.Tasks;
    using System.Diagnostics;

    namespace ConsoleApplication1
    {
        class TYPENAME
        {
        }
    }";

            var expected = VerifyCS.Diagnostic("HelloRoslyn").WithLocation(0).WithArguments("TypeName");
            await VerifyCS.VerifyCodeFixAsync(test, expected, fixtest);
        }
    }
}
Right-click the project → Run Tests to see the test results:
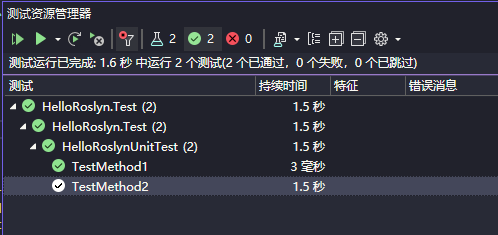
In real development, we obviously won’t test by referencing the analyzer from a project and writing some code against it. That would mean reinstalling the NuGet package over and over and would interfere with editing and building the real projects; it’s inefficient and ineffective. So every time we write an Analyzer and all its CodeFixProviders, we write test cases and do thorough unit testing.
The HelloRoslyn.Vsix Project#
This project produces a VS extension installer (with the .vsix extension). Double-clicking it opens the extension installation window.
Note that the extension only analyzes code while the IDE is running, i.e. during editing; it doesn’t take effect at compile time. If you need code analysis at compile time, you have to add it as a NuGet package reference to the projects being analyzed.
Creating a Sandbox Project to Test the NuGet Package#
First, copy the NuGet package file produced by HelloRoslyn.Package into a directory. This directory will serve as our NuGet source. For example:

Then add the local NuGet source in Visual Studio:
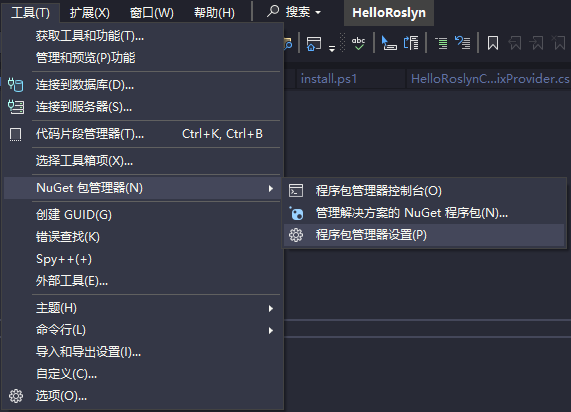
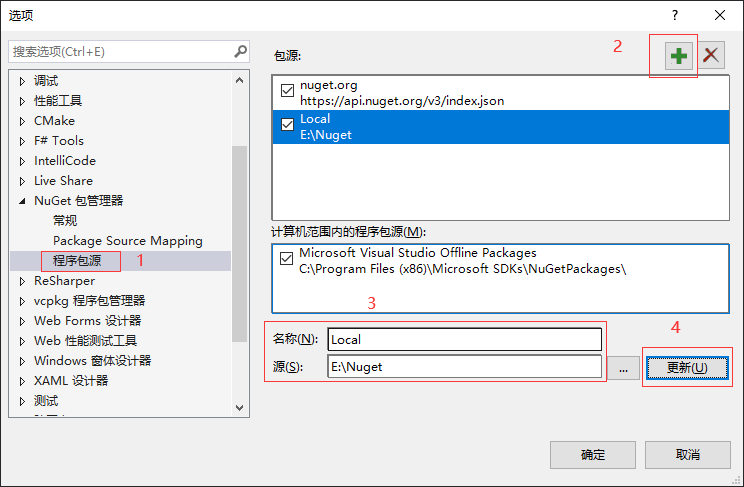
Remember to click the Update button after entering the name and source.
After that, we can add the NuGet package reference (i.e. add the analyzer) to a sandbox C# console project.
Then we create any type whose name contains lowercase characters, and a warning shows up in the Error List:
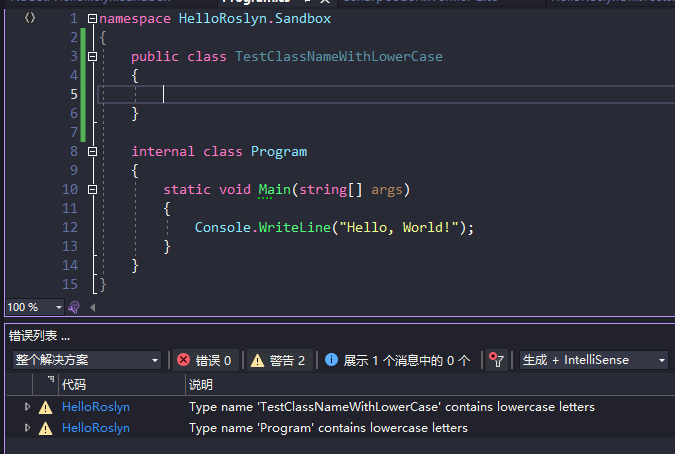
The missing blue squiggle is probably because warning display isn’t configured on my home computer.
Hovering over the class name, we also see the diagnostic message:
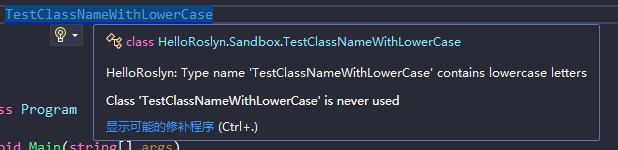
Click “Show potential fixes”, or press Ctrl + ., and the code fix options appear:
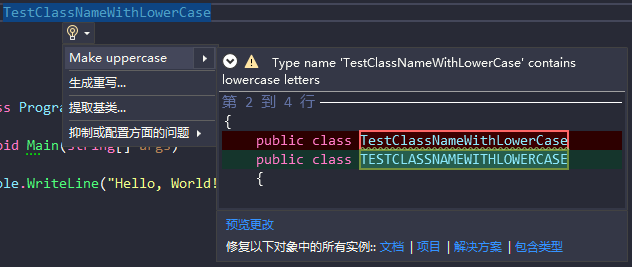
After choosing Make uppercase, our class name becomes all uppercase. This shows that our analyzer and code fix provider work fine in actual use.
Analyzer Development Workflow#
The basic workflow is:
- Decide the diagnostic ID, severity and other key diagnostic parameters
- Design the syntax analysis
- Design the semantic analysis
- Decide the conditions for reporting the diagnostic
Syntax Analysis#
During development, we rely on the syntax tree view to quickly see the code’s syntax tree structure and then think about how to write the analyzer.
Click View → Other Windows → Syntax Visualizer to open the syntax tree visualizer:
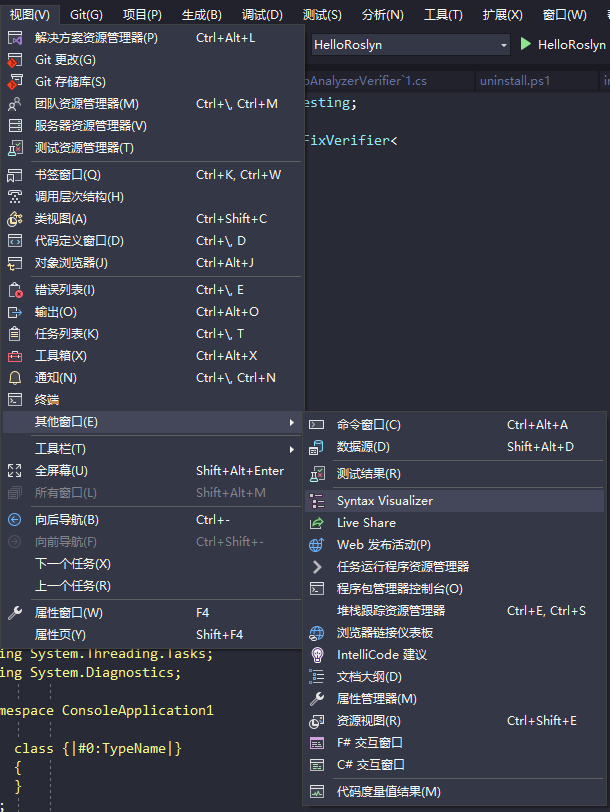
We can see the syntax tree structure of the code document and get every token along with its description.
For further development, refer to the following tutorial:
Get started with syntax analysis (Roslyn APIs) - C#An introduction to traversing, querying, and walking syntax trees. learn.microsoft.com
Semantic Analysis#
After syntax analysis, we can move on to semantic analysis.
Get started with semantic analysis - C#This tutorial provides an overview of working with semantic analysis using the .NET Compiler SDK. learn.microsoft.com
Fix Provider Development Workflow#
Next, we can write the fix providers.
The basic workflow has just one step: design the syntax transformation.
Syntax Transformation#
The fix logic of a fix provider is essentially a syntax transformation: creating new syntax structures that replace the original document or the entire original solution.
Get started with syntax transformation (Roslyn APIs) - C#An introduction to creating and transforming syntax trees. learn.microsoft.comNote that we don’t modify the original document or solution directly. Immutability is a core principle of the .NET Compiler Platform, applying to syntax trees, compilations, symbols, semantic models and more. So we replace the document or solution rather than modify it.

Integrating into the CI Process#
In fact, adding the analyzer as a NuGet package to each project to be analyzed is enough to get code analysis at compile time. If code violates the rules and the severity is error, the build is treated as failed.
In our server CI process, we build the whole solution with MSBuild, which can write warning-level and error-level output to two separate files. We can set the severity of rule violations to Error. Then we can write a command-line tool that reads the error-level output file: if it has any content, there is non-compliant code. The tool can use regular expressions or other means to extract the specific project, file, line number and so on, which then show up in the CI log, telling the responsible programmer to fix their code. (There are cases where programmers edit and commit code files without opening VS, for example when resolving SVN conflicts, or when making quick edits in Visual Studio Code or Notepad++.)
Using ReSharper’s Command-Line Tools#
ReSharper’s dotSettings configuration file contains code style settings, and it can actually implement part of the code analysis logic, mainly preset naming, formatting and syntax checks. When code violates the configured rules, you can assign different severity levels, such as ignore, hint, suggestion, warning or error.
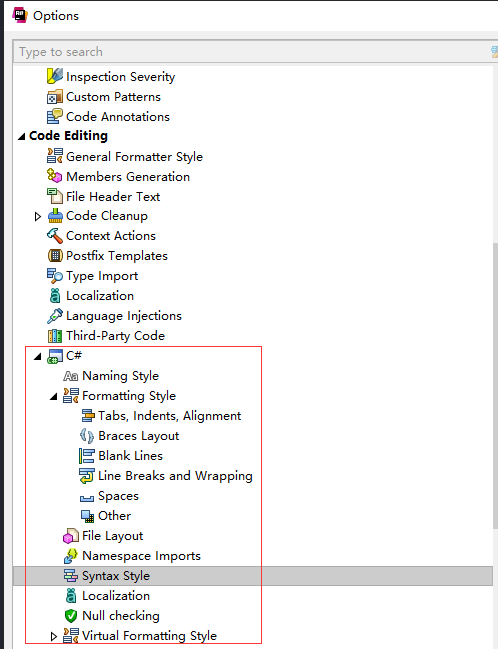
“Preset” means limited support, and that is its pain point. If you need highly customized code analysis, Roslyn is the inevitable choice. So why do we still use ReSharper?
The reasons are as follows:
- Our company has passed down a dotSettings configuration file from its early days, and the naming, formatting and syntax conventions in it are already settled and ready to use. We don’t want to reimplement these conventions in Roslyn; that would be a real waste of time. It’s doable, but costly. So we’ll keep this part of the code analysis in ReSharper. In our .NET 6.0 projects, we export the dotSettings to an editorConfig and promote the IDE-category diagnostics to the build category, so the corresponding analysis and diagnostics happen not only while the IDE is running but also at compile time.
- Some of the company’s projects haven’t upgraded their servers to .NET 6.0 and still use .NET Framework 4.6. For those projects that won’t move to .NET 6.0 any time soon, we have to provide a code analysis process for them as well, as much as we can.
In .NET 5.0 and later projects, we can configure the project’s editorConfig to promote some IDE warnings or errors to build warnings or errors, so the corresponding entries end up in MSBuild’s warning or error output files. This means that for .NET 6.0 projects, MSBuild alone meets our needs.
Code analysis in .NETLearn about source code analysis in the .NET SDK. learn.microsoft.com
This approach doesn’t work for .NET Framework, though. Our CI builds the solution with MSBuild, and some of the IDE code style rules we configured are not analyzed during the build, because they belong to the IDE category rather than the build category. In other words, they can’t be promoted and won’t appear in the output files, which is not what we want.
This is where ReSharper’s InspectCode comes in. It can analyze code directly without relying on MSBuild and output the results, which can likewise serve as the signal for whether CI should continue.
Code Analysis with InspectCode#
InspectCode is the code inspection tool included in ReSharper’s command-line tools. It analyzes the code’s syntax tree and checks for code that violates the rules; for each violation it generates an Issue. Its results can be written to a specified output file, in XML format by default. We can write a command-line tool that parses this XML file and checks whether it contains any Issue nodes to determine whether there is non-compliant code, which can then serve as the signal to break the CI process.
It supports dotSettings configuration, editorConfig configuration and command-line arguments.
Our most important command-line arguments are: --no-build to skip the MSBuild step, -job=8 to run the analysis in parallel on 8 cores, and -e=ERROR to set the minimum severity (only collect and report error diagnostics).
See the official documentation for details on configuration and command-line arguments; I won’t go into them here.
InspectCode Command-Line Tool | ReSharper ReSharper Help
Code Cleanup with CleanupCode#
CleanupCode is the code cleanup tool included in ReSharper’s command-line tools. It can fix code formatting, apply syntax styles, remove redundant code and more.
It supports dotSettings configuration, editorConfig configuration and command-line arguments.
See the official documentation for details on configuration and command-line arguments; I won’t go into them here.
CleanupCode Command-Line Tool | ReSharper ReSharper Help
We could consider running CleanupCode first in the CI process and then running InspectCode, but this approach hasn’t been discussed yet. Personally, I don’t think we should rely on tools to automatically fix code in the CI process. Fixing code should be fully the responsibility of the programmers who write it; otherwise it’s easy for a lazy mindset to set in, along the lines of “whatever, CI will always clean it up and commit it to Git/SVN for me.” I think that’s unacceptable: it’s a counterproductive optimization and goes against our original intent. Of course, that’s just my personal view; whether to adopt this approach is still up for discussion.
Summary#
In the era of game industrialization, we should pay attention to the consistency of all kinds of standards throughout the game development process and guarantee the quality of what we deliver. Only then can our games thrive, and only then will we have the chance to bring one high-quality game after another to players.
Thanks to Roslyn and ReSharper, which let us ensure code quality and style consistency as much as possible.
Some links for reference:
- 紫龙上海CTO王琦:我们对游戏工业化的探索 (Wang Qi, CTO of Zilong Shanghai: Our Exploration of Game Industrialization)
GitHub - dotnet/roslyn: The Roslyn .NET compiler provides C# and Visual Basic languages with rich code analysis APIs.The Roslyn .NET compiler provides C# and Visual Basic languages with rich code analysis APIs. - dotnet/roslyn
GitHub
 Tutorial: Write your first analyzer and code fix - C#This tutorial provides step-by-step instructions to build an analyzer and code fix using the .NET Compiler SDK (Roslyn APIs).
learn.microsoft.com
 ReSharper command line tools | ReSharper
ReSharper Help

Comments