This post was translated from the original with AI assistance. Read the original
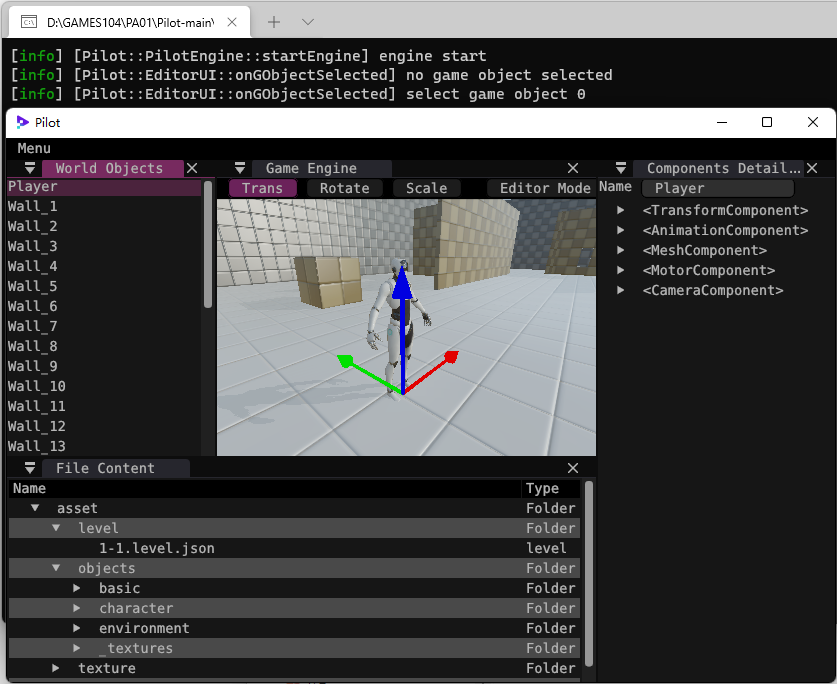
The Pilot engine is a mini game engine developed jointly by the GAMES104 course team. It’s small, but it has everything it needs. It’s open source, so we can grab its source code on GitHub. Below I’ll briefly go over how to get the Pilot engine running on Windows and debug it with breakpoints.
Getting It Running on Windows#
Getting Pilot to compile and run on Windows is the first assignment of GAMES104, and it’s also where our journey of learning from Pilot begins.
Get Your Tools Ready#
The tools you need are:
- Git 2.1 or later. Just install it, generate a public key, and add the key to GitHub.
- CMake 3.19 or later. Just install it, and make sure it’s added to PATH.
- Visual Studio 2019 or later. When installing, just tick the desktop C++ workload.
- Vulkan SDK for Windows download here. Just install it.
Get the Source Code#
Go to https://github.com/BoomingTech/Pilot
You can clone the repository or download it as a ZIP file, or of course fork it first and then clone.
For now I’d recommend cloning the repository and pulling updates whenever there are any.
Build the Release Version#
If you only need the Release build, just double-click build_windows.bat in the root directory.
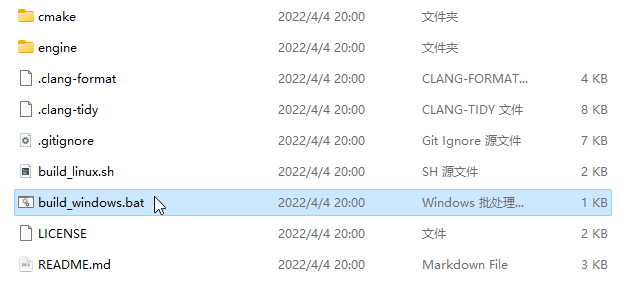
The build commands will then run. Once they finish, two new folders will appear in the root directory:
- bin
- build
At this point you can run bin/PilotEditor.exe directly to launch the Release build of the Pilot editor, and you can already take a screenshot and hand in your homework hhh.
Build and Debug the Debug Version#
Since we want to learn from Pilot, breakpoint debugging is a must.
In the build folder that was just generated, the solution file we need has already been created: Pilot.sln. Double-click it to open it in Visual Studio.
Once it’s open, the solution explorer looks like this:
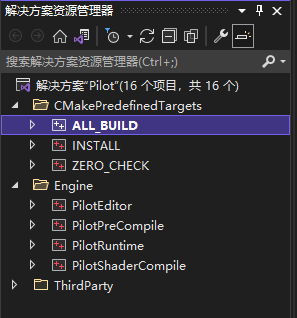
The default startup project is currently ALL_BUILD, and we need to change it to PilotEditor.
Just right-click the PilotEditor project -> Set as Startup Project.
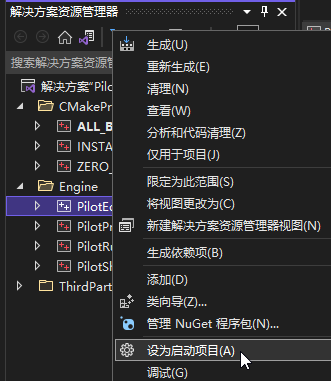
The project is already in Debug mode by default, so we can just click the green triangle to start debugging.
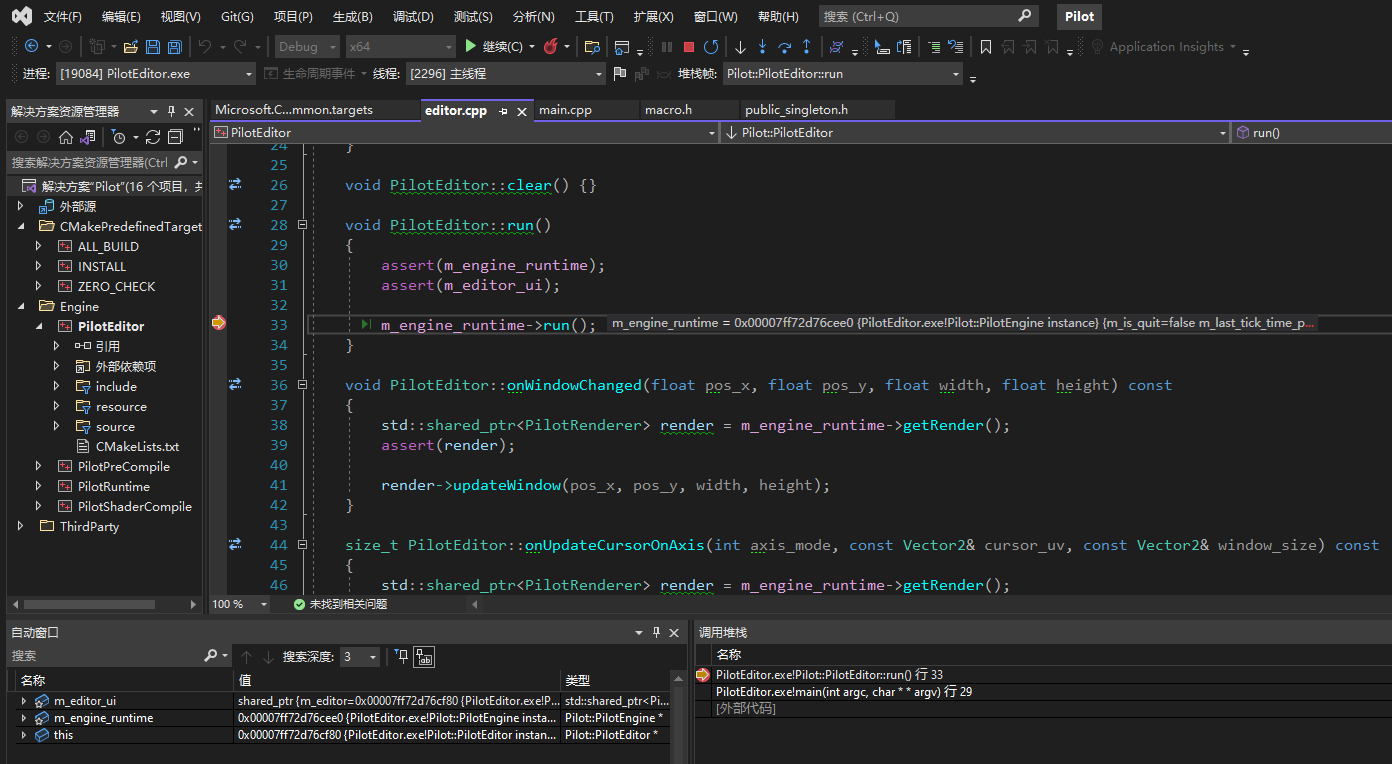
For example, let’s set a breakpoint in the PilotEditor::run function:
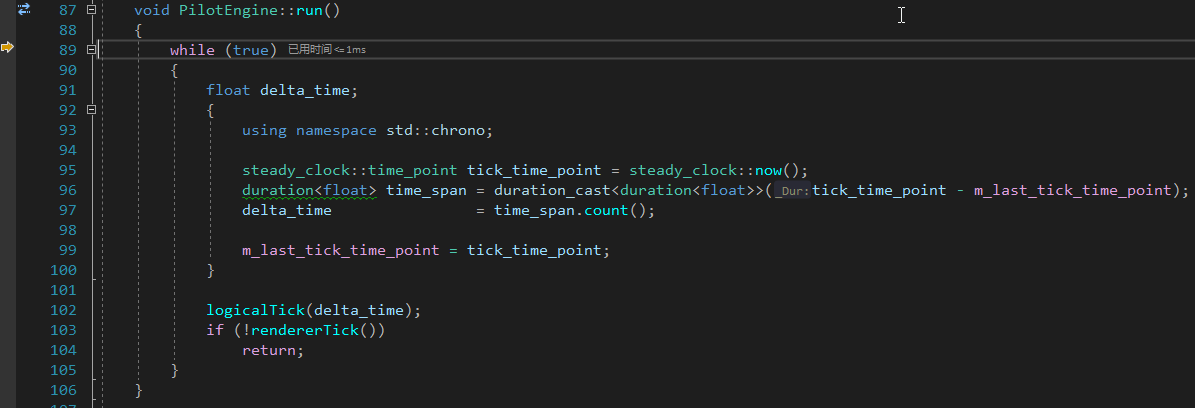
From here you can step through and see how the runtime ticks each module internally:
Comments